Glossary
Glossary
Terminology

Building blocks are the economic sectors, such as energy, transport or industry, and cross-cutting areas, such as finance, innovation, and lifestyles, in which transformation is needed to achieve a climate neutral society by 2050, and across which ECNO tracks progress.
Building block assessment
Acceleration factor
Or the ‘required change in speed’ is the ratio of the required change versus the past change on a given indicator. This results in the example formulation: ‘We need to increase our annual emission reductions to at least 4.9 Mt CO2e per year – or 2.6 times faster than the 1.9 MtCO2e per year achieved in the past’.
Benchmarks
Future reference points against which progress for each indicator is compared. ECNO derives benchmarks from official EU sources, such as directives, regulations, strategies, and action plans, including their related impact assessments. Benchmarks often come in the form of quantified policy goals or targets.
Climate neutrality
Stands for the objective of achieving net zero greenhouse gas (GHG) emissions. This means that emissions are brought down as close to zero as possible, with remaining, difficult to abate emissions balanced by GHG removals within a given country or region.
Enablers
The supporting conditions and underlying changes needed to meet the objectives in a given building block. They are the opposite of barriers or inhibitors.
Historical data
Includes, but is not limited to, statistics from Member States harmonised and provided by Eurostat or the European Environment Agency (EEA) as well as from international organisations such as the OECD, FAO, or World Bank.
Indicators
Track the historical development and status of enablers and objectives based on quantitative data. An assessment of indicator progress compares the trend against the required development to meet a future reference point, where data and relevant benchmarks are available.
Objectives
Describe what needs to be achieved in each building block to reach climate neutrality.
Required change
The change that underlies a pathway that meets the identified benchmark or target. Where benchmarks are missing, the required change indicates a direction and speed of change.
Trend
The development of an indicator over time based on historical data. ECNO’s trendline is a straight, best-fit line that smooths out the variation in historical developments based on all data points, providing a sense of the general progress over time.
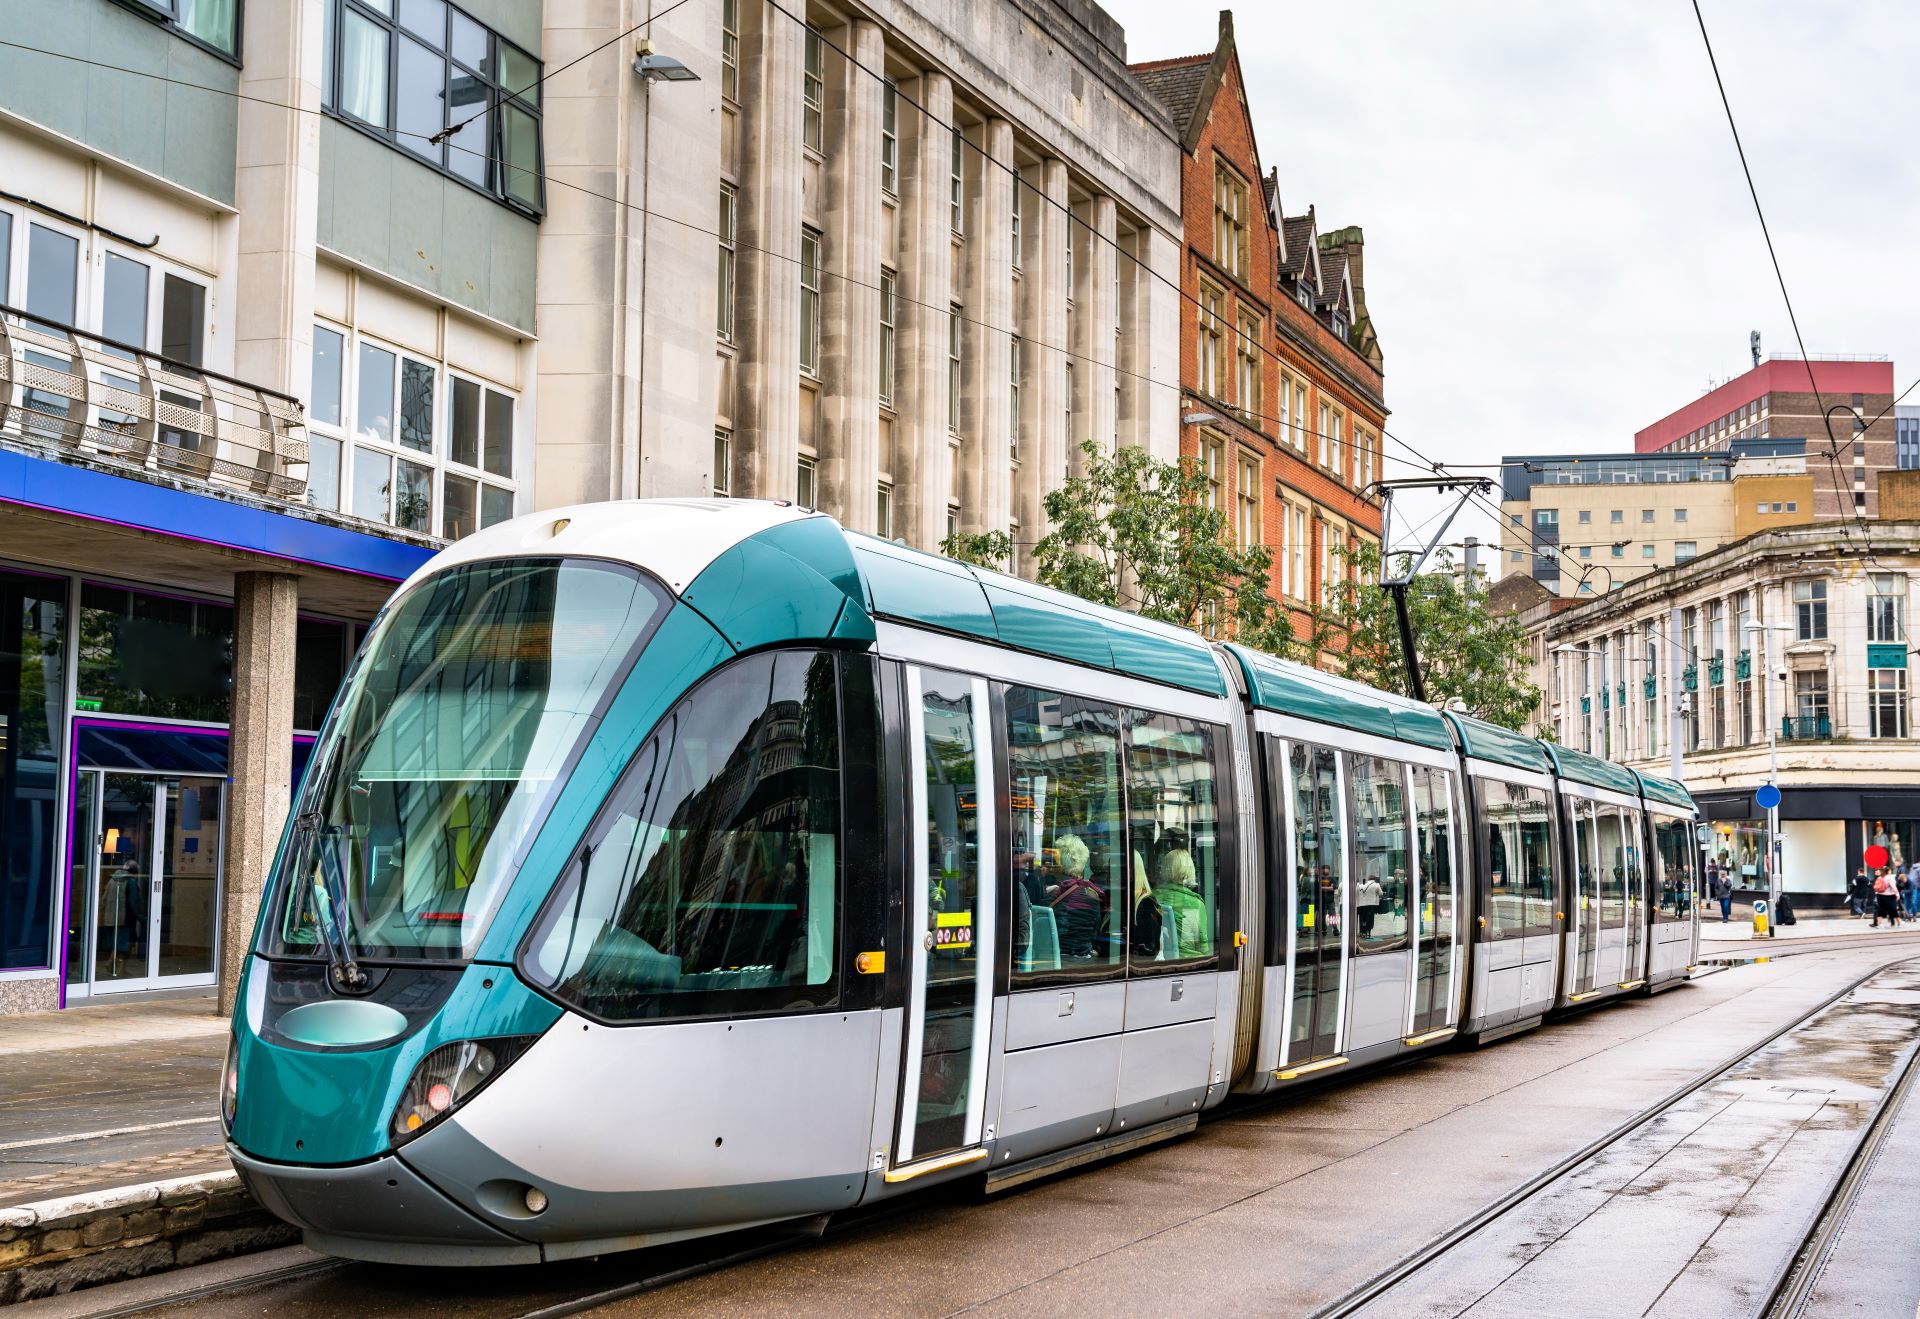

Mobility
Mobility connects people and sustains economies. For a transformative shift, reducing motorised transport, promoting clean modes, and decarbonising remaining transport is essential.
OVERVIEW:
Progress in mobility has been far too slow
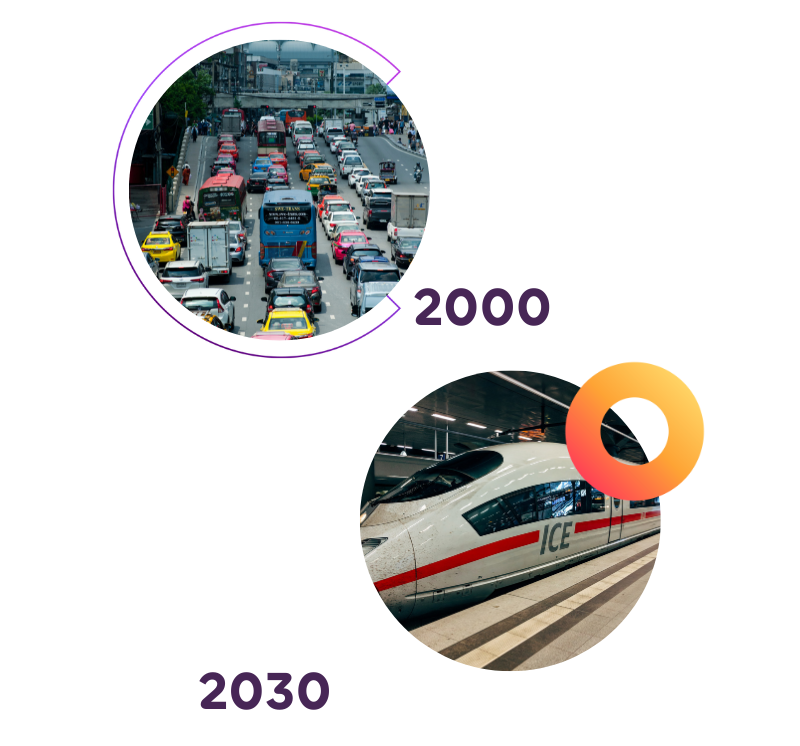
There has been a significant policy push towards cleaner vehicles, but more action is needed to shift away from road transport and to manage overall motorised transport demand.
Progress towards climate neutrality in the mobility sector was still far too slow in the assessed period, but there are promising signs of improvement for many enablers. Pandemic-induced emission reductions are rebounding but remain below prepandemic levels. Overall, the growth in passenger and freight transport demand somewhat slowed. COVID-19 negatively impacted the modal split of passenger transport, but passengers seemed to slowly be shifting back from road to rail transport again. The modal split for freight transport was still heading in the wrong direction. Although increasing, the pace of zero emission vehicle (ZEV) adoption and infrastructure buildout was still far too slow.
Transport policy at the EU level has largely focused on implementing zero and low emission motorised transport. The EU has an ambitious vision for ZEVs and is backing it up with stricter CO2 emission performance standards and the Alternative Fuels Infrastructure Regulation (AFIR). However, the EU could make further progress by going beyond deploying ZEVs: overall motorised transport volumes need to be reduced and, where motorised transport is unavoidable, a greater modal shift for passenger and freight transport from road to rail needs to be facilitated. The proposed revision of the Trans-European transport network (TEN-T) is the EU’s first and primary tool for enabling a union-wide modal shift. Reducing motorised transport demand is key to reducing GHG emissions from transport, but the EU’s Sustainable and Smart Mobility Strategy (SSMS) does not consider moderating motorised transport demand.
To become climate neutral by 2050, ZEV uptake could be facilitated by building out recharging infrastructure, providing guidance on financial incentives, and addressing gaps in the CO2 emission standards. To address the policy gap for managing the demand for motorised transport and further incentivising the modal shift away from road transport, the EU could incorporate transport demand moderation into the SSMS and adopt the revised TEN-T. The EU could also be more active in coordinating non-motorised transport infrastructure, and in rural areas, in expanding rail networks.
DEEP DIVE
Implementing zero emission transport
The adoption of Zero and Low Emission Vehicles (ZEVs) has significantly increased across all Member States, with most using financial incentives or bonus-malus systems, to promote their purchasing. However, the predominance of ZEVs in the high-priced vehicle segment means their uptake remains especially notable in Member States with greater purchasing power.
INSIGHT TWO
Progress varies across Member States
There is a risk of backtracking on the landmark agreements on phasing out the sale of Internal Combustion Engines (ICEs).
INSIGHT THREE
Shift to active and public mobility needed
The EU should do more to ensure the affordability of and access to electric vehicles and recharging infrastructure, while adopting proposals, such as the Trans-European Transport Network (TEN-T), to enable and incentivise shifts towards public and active mobility.

OBJECTIVES
Objectives describe what needs to be achieved in each building block to reach climate neutrality.
Objective
Reducing GHG emissions and carbon intensity in transport
Overall, GHG emission reductions in transport were far too slow, excluding the extraordinary impacts of the COVID-19 pandemic on mobility and considering the already apparent rebounding of GHG emissions after 2020. Over the next three decades, emission reductions need to occur 1.4 times faster to meet the EU’s 2050 target of a 92% reduction in GHG emissions relative to 2005 levels.
GHG emissions from transport
This indicator shows past development in EU transport sector GHG emissions in comparison to the EU target of reducing CO2 emissions from transport by 92% in 2050 relative to 2005.
Data show an annual decrease of 20,06 Mt CO2e between 2017 and 2022. To meet the target, the required annual change between 2022 and 2050 needs to be 29,7 Mt CO2e, which is 1.4 times faster than the current rate of progress.
The indicator includes emissions from the transport sector including international aviation but excluding international shipping.
Carbon intensity of passenger transport
There is currently no EU-wide aggregated data available on carbon intensity of passenger transport. Data is therefore insufficient to assess the progress of this indicator.
This indicator shows past development in EU emissions intensity of passenger transport.

ENABLERS
Enablers are the supporting conditions and underlying changes needed to meet the objectives in a given building block. They are the opposite of barriers or inhibitors.
Enabler 1
Managing motorised transport demand
Taking into account the growth of the passenger transport volume between 2015 and 2019 and the visible postpandemic rebounding in 2021, the progress towards this indicator was too slow. Given that the number of passenger cars per EU inhabitant increased to a record-high 0.56 in 2022 and that Europe’s population will continue to grow until 2030, union-wide demand for motorised transport is likely to continue increasing. Freight transport volume continued to increase but at a slower rate, nearly compatible with the EU’s 2050 climate neutrality target.
Total passenger transport volume
This indicator shows past development in the growth of passenger transport volume in comparison to 2050 targets derived from the most stringent transport activity growth rates by modes outlined in the impact assessment of the EU long term strategy.
The data show an annual decline of 310 billion passenger-km between 2016 and 2021. To meet the target, the required annual change between 2021 and 2050 could increase by 95 billion passenger-km, which means that this indicator is too slow.
The indicator shows total passenger kilometres travelled by trains, passenger cars, motor coaches, buses and trolley, buses, seagoing vessels and aircrafts.
Total freight transport volume
This indicator shows past development in the growth of freight transport volume in comparison to 2050 targets derived from the most stringent transport activity growth rates by modes outlined in the impact assessment of the EU long term strategy.
The data show an annual increase of 32455 Mtonne-km between 2016 and 2022. To meet the target, the required annual change between 2022 and 2030 must be reduced to 28267 Mtonne-km, which is 0.9 times lower than the current rate of progress.
The indicator shows total tonnes kilometres transported on railways, roads and inland waterways.
Enabler 2
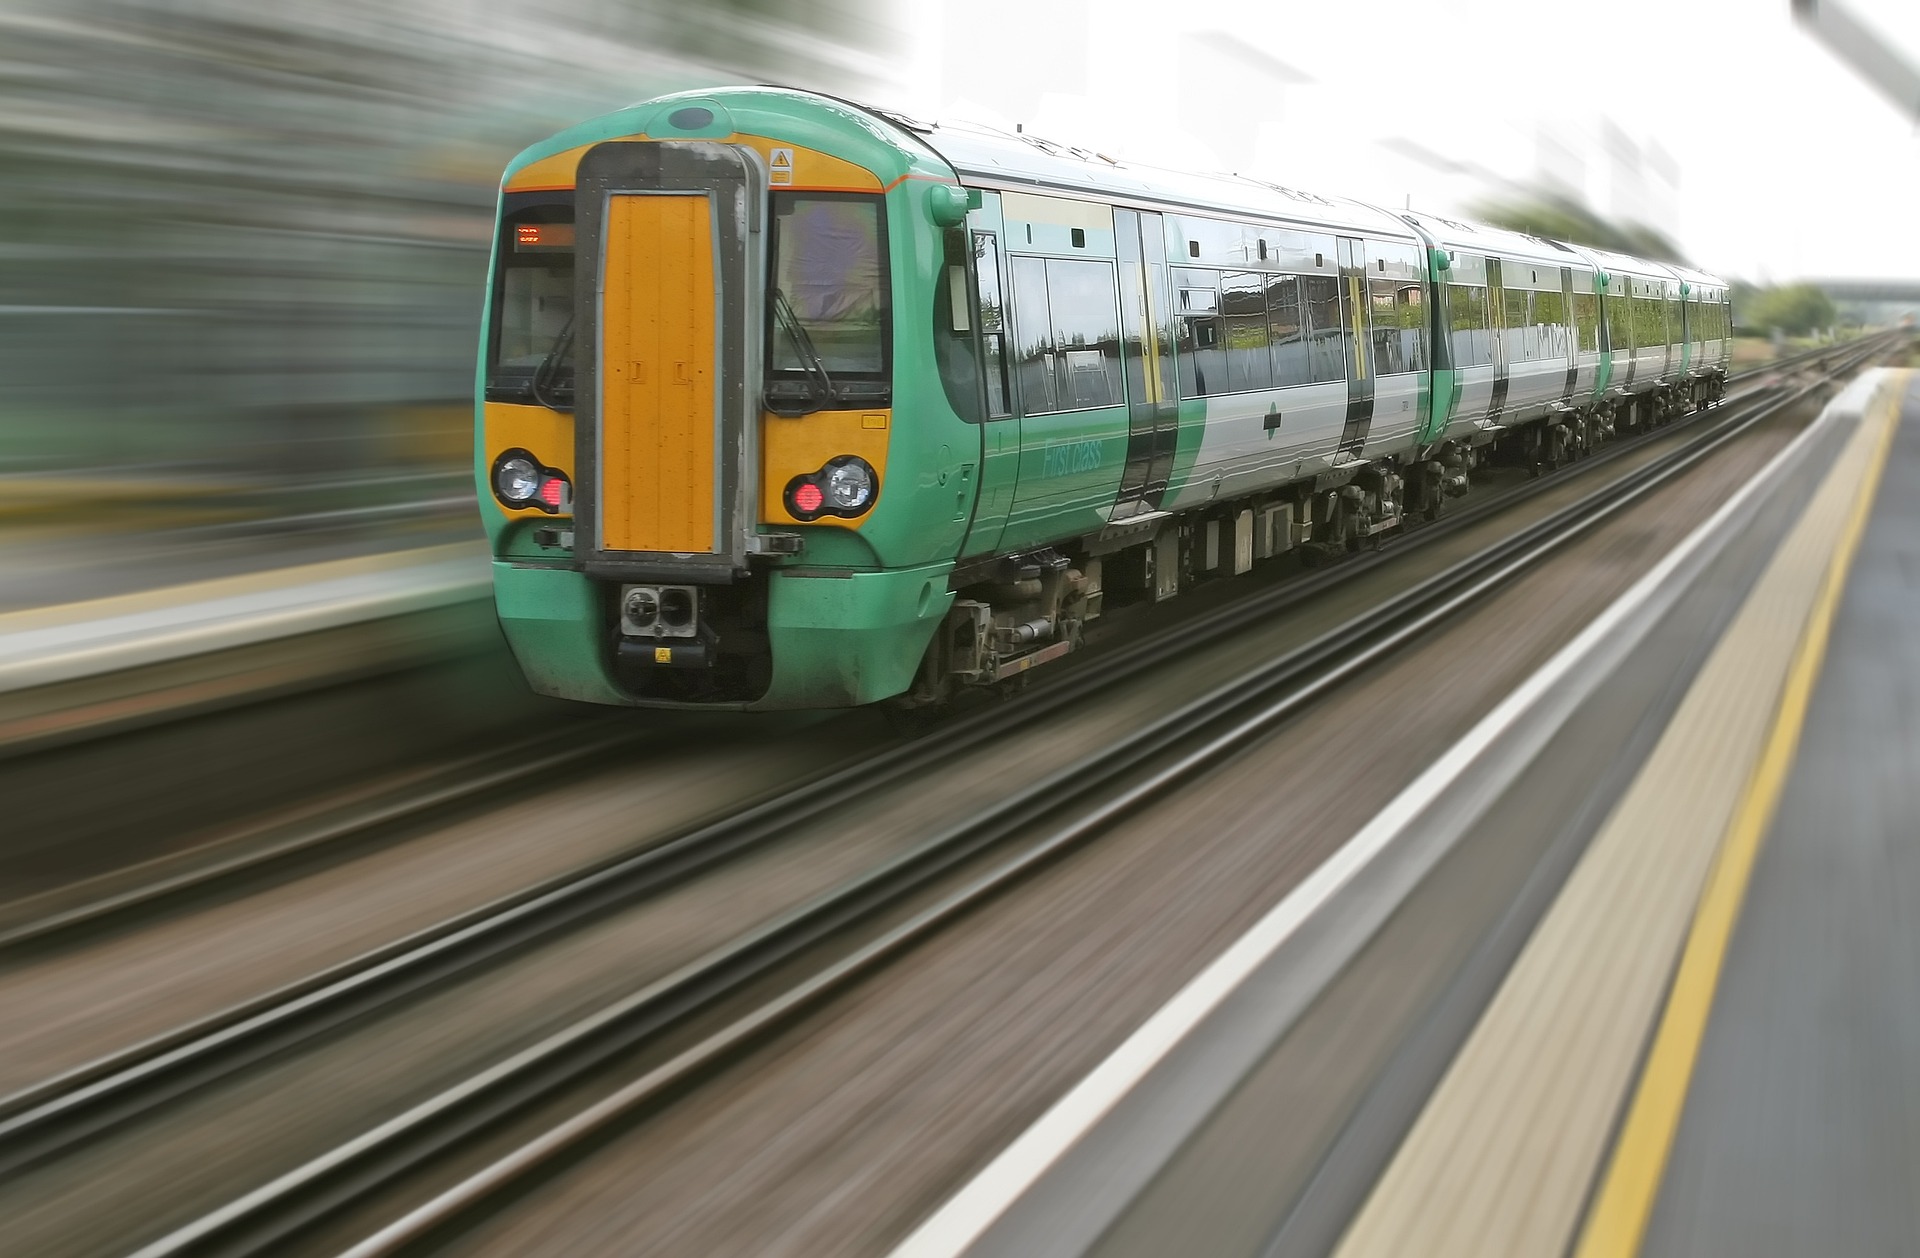
Enabling modal shift
The modal split in passenger and freight transport was headed in the wrong direction in the assessed period. For passenger transport, the pandemic triggered an unprecedented shift away from public mobility towards private cars. This year’s report includes data from 2021 which indicate the beginning of the return to positive pre-pandemic passenger transport trends. The modal split in freight transport volume was largely unaffected by the pandemic: the share of freight transported by road was steadily increasing, while the shares on rail and inland waterways were decreasing. This represents a modal shift that is trending in the opposite direction of what is needed to further reduce sectoral GHG emissions.
Share of passenger transport on road
This indicator shows past development in the share of passenger transport on road in comparison to the EU target of not surpassing a 75% share of passenger transport in 2050.
The data show an annual increase of 1.7%-points between 2016 and 2021. To meet the target, the required annual change between 2021 and 2050 needs to be an annual decrease of 0.4%-points, which points into the opposite direction than the current rate of progress.
The indicator refers to the share of passenger kilometres from road transport. The development of this indicator was heading in the wrong direction.
Share of passenger transport on rail
This indicator shows past development in the share of passenger transport on rail in comparison to the EU target of reaching 10% share of passenger transport in 2050.
The data show an annual decrease of 0.3%-points between 2016 and 2021. To meet the target, the required annual change between 2021 and 2050 needs to be an annual increase of 0.1%-points, which points into the opposite direction than the current rate of progress.
The indicator refers to the share of passenger kilometres from rail transport. The development of this indicator was heading in the wrong direction.
Share of freight transport on road
This indicator shows past development in the share of freight transport on road in comparison to the EU target of not surpassing a 69% share of passenger transport in 2050.
The data show an annual increase of 0.6%-points between 2016 and 2021. To meet the target, the required annual change between 2021 and 2050 needs to be an annual decrease of 0.3%-points, which points into the opposite direction than the current rate of progress.
The indicator refers to the share of tonnes kilometres from road transport. The development of this indicator was heading in the wrong direction.
Share of freight transport on rail
This indicator shows past development in the share of freight transport on rail in comparison to the EU target of reaching a 25% share of passenger transport in 2050.
The data show an annual decrease of 0.4%-points between 2016 and 2021. To meet the target, the required annual change between 2021 and 2050 needs to be an annual increase of 0.2%-points, which points into the opposite direction than the current rate of progress.
The indicator refers to the share of tonnes kilometres from rail transport. The development of this indicator was heading in the wrong direction.
Enabler 3
Implementing zero emission transport
ZEVs must make up 99% of the total share of passenger cars, while the share of ZEVs in the heavyduty vehicle (HDV) stock needs to increase to 70% by 2050 to be compatible with climate neutrality. The share of ZEVs in new passenger car registrations reached a record high in 2022 and was increasing by 4.5%-points per year. The number of recharging stations increased by over 190% per year between 2018 and 2023, but this development needs to accelerate to be compatible with the EU’s target of approximately 16 million public recharging points in 2050. Read the deep dive on this enabler here.
Share of EVs in passenger car stock
This indicator shows past development in the uptake of electric vehicles in the passenger car fleet in comparison to the EU target of reaching 99% share in electric vehicles in 2050.
Data show an annual increase of 0.4%-points between 2017 and 2022. To meet the target, the required annual change between 2022 and 2050 needs to be 3.5%-points, which is 8.4 times faster than the current rate of progress.
The indicator shows the cumulative share of battery electric vehicles (BEV) and plug-in hybrid vehicles (PHEV) in the passenger vehicle fleet.
Share of ZEVs in heavy-duty vehicle stock
This indicator shows past development in the uptake of zero emissions vehicles in the heavy-goods vehicle fleet in comparison to the more stringent end of EU target of reaching a combined 70% share in vehicles with battery, fuel cell, or hybrid powertrains 2050.
Data show an annual increase of 0.01%-points between 2017 and 2022. To meet the target, the required annual change between 2022 and 2050 needs to be 2.5%-points, which is 444 times faster than the current rate of progress.
The indicator shows the cumulative share of battery electric vehicles (BEV) and fuel cell vehicles in the trucks fleet.
Share of ZEVs in new passenger car registrations
This indicator shows past development in new registrations of zero emissions vehicles in the passenger car fleet in comparison to the EU’s 2035 target for 100% ZEVs in new passenger car registrations. To meet the target, the required annual change between 2022 and 2035 needs to be 6.0%-points, which is 1.3 times faster than the current rate of progress.
The indicator is the cumulative share of battery electric vehicles (BEV), plug-in hybrid vehicles (PHEVs), and fuel cell electric vehicles (FCEVs) in new vehicle registrations in the passenger car fleet.
Total number of recharging points
This indicator shows past development in the buildout of the EU’s vehicle recharging network in comparison to the more stringent end of EU’s 2050 target of 16m recharging points. To meet the target, 579,123 recharging points need to be built per year between 2023 and 2050, which is 3.8 times faster than the current rate of progress.
The indicator is the total number of operational recharging points that meet the Alternative Fuel Infrastructure Regulation (AFIR) classification.