Glossary
Glossary
Terminology
Building blocks are the economic sectors, such as energy, transport or industry, and cross-cutting areas, such as finance, innovation, and lifestyles, in which transformation is needed to achieve a climate neutral society by 2050, and across which ECNO tracks progress.
Building block assessment
Acceleration factor
Or the ‘required change in speed’ is the ratio of the required change versus the past change on a given indicator. This results in the example formulation: ‘We need to increase our annual emission reductions to at least 4.9 Mt CO2e per year – or 2.6 times faster than the 1.9 MtCO2e per year achieved in the past’.
Benchmarks
Future reference points against which progress for each indicator is compared. ECNO derives benchmarks from official EU sources, such as directives, regulations, strategies, and action plans, including their related impact assessments. Benchmarks often come in the form of quantified policy goals or targets.
Climate neutrality
Stands for the objective of achieving net zero greenhouse gas (GHG) emissions. This means that emissions are brought down as close to zero as possible, with remaining, difficult to abate emissions balanced by GHG removals within a given country or region.
Enablers
The supporting conditions and underlying changes needed to meet the objectives in a given building block. They are the opposite of barriers or inhibitors.
Historical data
Includes, but is not limited to, statistics from Member States harmonised and provided by Eurostat or the European Environment Agency (EEA) as well as from international organisations such as the OECD, FAO, or World Bank.
Indicators
Track the historical development and status of enablers and objectives based on quantitative data. An assessment of indicator progress compares the trend against the required development to meet a future reference point, where data and relevant benchmarks are available.
Objectives
Describe what needs to be achieved in each building block to reach climate neutrality.
Required change
The change that underlies a pathway that meets the identified benchmark or target. Where benchmarks are missing, the required change indicates a direction and speed of change.
Trend
The development of an indicator over time based on historical data. ECNO’s trendline is a straight, best-fit line that smooths out the variation in historical developments based on all data points, providing a sense of the general progress over time.


OVERVIEW:
Progress on the Just and Inclusive Transition has been too slow
There is clear progress visible in ensuring a just and inclusive transition, despite the onset of the energy crisis. Nevertheless, thorough implementation and better data are needed to ensure effective support, investments, and reskilling.
The overall classification of the progress related to just transition remained too slow in the period assessed. Progress in the just transition objective – ‘no region and no individual left behind’ – was mixed, having been hindered by the 2022 energy market volatility. While the decline of the poverty rate in the ‘EU regions in transition’ was on track, the number of people in material deprivation increased in 2022 because of the fossil fuel energy crisis. The biggest encouragement stems from the trendlines related to job opportunities. The employment rate in ‘EU regions in transition’ was assessed as on track, with employment in the renewable energy sector (all Renewable Energy Sources (RES)) having soared in 2022. As the 2022 events also resulted in an increase in subsidies to vulnerable energy groups, we saw a reduction in the share of energy efficiency subsidies. Developments related to regional just transition policies were encouraging, with initial data signalling high absorption of regional policy funds.
The EU policy landscape related to just transition constitutes an increasingly comprehensive framework. Its cornerstone in regions most affected by the transition is shaped by the support schemes under the Just Transition Mechanism, the Just Transition Fund (JTF), and the Just Transition Platform. The European Pillar of Social Rights Action Plan supports well-functioning labour markets and social protection systems. It also outlines actions to be taken for the reduction of poverty. From 2026, the Social Climate Fund (SCF) will become operational and will provide dedicated funding to protect the vulnerable groups affected by the upcoming introduction of carbon pricing in the buildings and transport sectors. Other relevant political instruments are scattered across EU legislation, notably in the Fit for 55 package and in the National Energy and Climate Plans (NECPs).
To deliver the EU goals, it is crucial to effectively implement reforms outlined by the Member States (MS) in Territorial Just Transition Plans. This includes taking further action towards bridging the employment gaps and increasing job opportunities for workers from sectors affected. The improvement of labour market statistics and diagnosis of future demanded skills will be important keys to line up effective reskilling and upskilling programmes. On a national level, a focus is needed on a sound, knowledgebased preparation of Social Climate Plans (SCPs), which information about measures and investments realised using the SCF.
DEEP DIVE
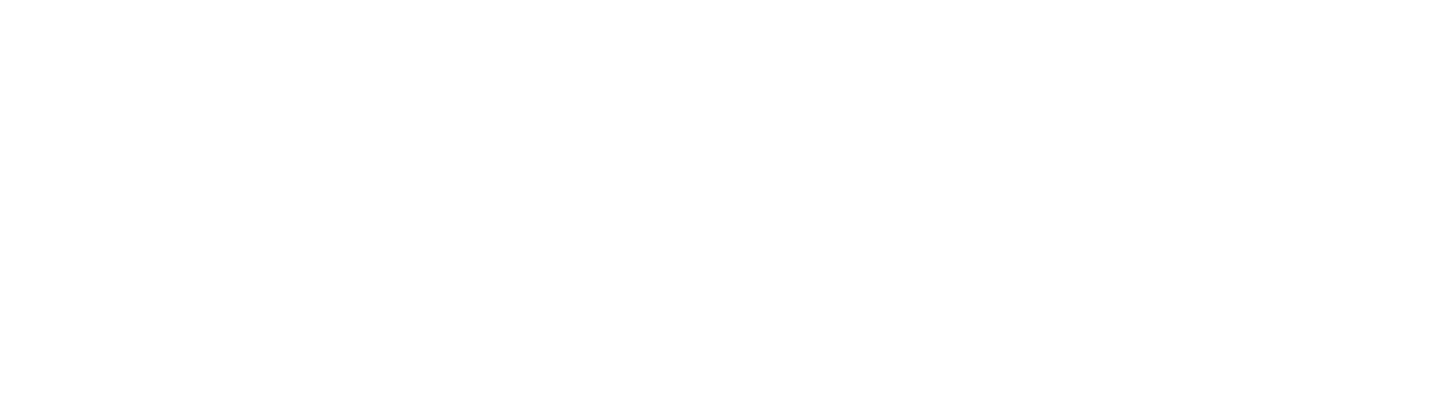
Creating job opportunities
The employment rate in the regions most affected by the transition is progressing at a pace that is similar to the pace for the whole EU. Job creation in renewable energy has increased most in Portugal, followed by Germany and Spain, with photovoltaics being the most employing technology. National programmes such as the ‘Green Skills and Job Programme’ in Portugal or a training academy in a former coal region in Romania are supporting this development.

OBJECTIVES
Objectives describe what needs to be achieved in each building block to reach climate neutrality.
Objective
Leaving no region and no individual behind
Some of the key factors driving the dynamics around just transition were the pandemic in 2020 and the Russian war in Ukraine starting in 2022 with the subsequent fossil fuel energy crisis. With regards to ’no region left behind’, the share of people who are at risk of poverty or social exclusion in the EU’s regions most affected by the energy transition continued to decrease in 2022. However, considering the wider impacts of the aforementioned crises the pace of that change slowed down in recent years. The material deprivation rate – a measure for ‘no individual left behind’ – increased in 2022 for all four categories considered, with the biggest rise in the inability to keep homes adequately warm. The changes were limited due to emergency policies and earlier progress in the energy transition.
Regional poverty rate
This indicator shows past development in the ‘At risk of poverty and social exclusion’ rate in 25 carbon-intensive regions. The benchmark for this objective is set by the European Pillar of Social Rights Action Plan.
The data show that the share of Europeans living in carbon-intensive regions who are at risk of poverty and social exclusion saw an annual decrease of 2.1%-points between 2017 and 2022. Past change was slightly too slow requiring at least 0.4%-points per year to deliver the required reduction of poverty and social exclusion by 2030.
Three separate measures are combined to calculate a number of ‘People at risk of poverty and social exclusion’. The indicator outlines the share of people with an equivalised disposable income (after social transfer) below the at-risk-of-poverty and social exclusion threshold, which is set at 60 % of the national median equivalised disposable income after social transfers, people suffering from severe material deprivation or people below 65 years old living in households with very low work intensity. Here it is given at NUTS 2 level which divides countries into regions with around 800,000 to 3 million inhabitants and compared to EU27 average.
We identify 25 carbon-intensive regions with available NUTS 2 level data in accordance with the list of European carbon-intensive regions developed by (OECD, 2023).
Average of four relevant sub-indicators in the material deprivation rate
This indicator shows past development in the four selected sub-indicators in the ‘Material deprivation’ rate. The benchmark for this objective is set by the European Pillar of Social Rights Action Plan.
The data show an average annual decrease of 0.1%-points between 2017 and 2022 which means that the indicator is far to slow reaching the poverty and social exclusion reduction target.
Material deprivation refers to a state of economic strain and durables, defined as the enforced inability (rather than the choice not to do so) to pay unexpected expenses and afford basic goods and services. Here, it consists of four sub-indicators related to climate transition: the inability a) to pay rent, mortgage, or utility bill, b) to keep their home adequately warm, c) to eat meat or proteins regularly, d) to go on holiday.
ENABLERS
Enablers are the supporting conditions and underlying changes needed to meet the objectives in a given building block. They are the opposite of barriers or inhibitors.
Enabler 1
Creating job opportunities
Job opportunities in the EU increased in the period assessed, even if the pace of progress was still too slow. The employment rate in the EU’s most vulnerable regions was the highest recorded so far. However, significant inequalities between regions remain. Employment in the renewable energy sector (all RES) showed significant growth in 2022, and thus this indicator was almost assessed as on track – a significant change compared to last year’s far too slow classification. Employment in environmental goods and services also saw a steady increase, this however is still too slow. Thus, while the classifications of some of the indicators related to job opportunities were still too slow, recent trends show encouraging signs of improving momentum.
Employment in environmental goods and services
This indicator shows past development in the employment in environmental goods and services in two subcategories: Protection of ambient air and climate (CEPA 1) and Management of energy resources (CREMA 13).
The data show an annual increase of 2.1% between 2015 and 2020 which was going in the right direction but need to increase in speed.
The environmental goods and services sector (EGSS) accounts report on the economic sector that generates environmental products, i.e., goods and services produced for environmental protection or resource management. This calculation includes two subgroups within EGSS: CEPA 1 and CreMA 13.
Employment rate in regions
The data show an annual increase of 0.7% per year between 2017 and 2022. This development was heading in the right direction and was on track to achieve EU’s overall employment goal of 78% employment rate in 2030.
The indicator measures the share of employed people aged 20-64 in the total population of people aged 20-64 in EU regions in transition. These are defined as NUTS 2 EU regions (according to Eurostat’s nomenclature of territorial units for statistics) which are eligible to obtain funds from the Just Transition Fund or have been identified by OECD as carbon intensive.
Employment in renewable energy market
This indicator shows past development in the direct and indirect employment in all Renewable Energy Sources (RES) sectors.
The data show an annual increase of 4.6% between 2017 and 2022. As the RES industry is expected to be a predominant sector for green jobs creation, this development was heading in the right direction, but far too slow and should accelerate in the future.
This indicator refers to gross employment. It is an estimate of direct employment, such as RES manufacturing, plants construction, management, engineering, operation and maintenance, as well as indirect jobs in the supply chain, such as transport.
Enabler 2
Fostering regional just transition policies
All MS have now submitted their Territorial Just Transition Plans. The Just Transition Fund supports these plans. Data regarding the amount of money accessed already by MS indicate that, as of March 2024, over 30% of the total allocation has already been distributed. This signals a positive development of the expected high absorption of EU just transition funds but also carries a risk of financial resources running out before 2030 if the amount available is not increased in the future.
JTF progress implementation
This indicator shows the pipeline of the JTF. The benchmark for this indicator will be 100% funds allocated by 2027 (end of the 2021-2027 multiannual financial framework).
We expect JTF implementation data to be available in the future (as it is with the previous multi-year financial framework data) and provided by the European Cohesion Open Data platform.
This indicator shows the project pipeline for the Just Transition Fund. This includes resources allocated (decided) relative to the total amount available.

Share of accepted Territorial Just Transition Plans
This indicator shows how many TJTPs were accepted by the EC, framing the Just Transition financing in regions.
The data show that roughly 96% of the Territorial Just Transition Plans were accepted by May 2023, with only three Bulgarian regions waiting for the final submission of their plans. Although the process should already be completed, it is now rated as on track with TJTPs delivery with the assumption that it will be finished this year at the latest.
This indicator shows the share of accepted Territorial Just Transition Plans in all submitted plans.

Enabler 3
Supporting vulnerable groups with the right policy mix
The energy market volatility of 2022 brought significant, but divergent, changes in both the share of energy subsidies distributed to households and the share of support dedicated to the improvement of energy efficiency. Even though the rate of funds distributed to households almost doubled between 2021 and 2022, this was almost entirely due to direct fossil fuel subsidies. While energy efficiency support also grew in the same period, its share dropped as a result of this overall increase.
Share of support for energy efficiency purposes
This indicator shows past development in the share of EU energy subsidies distributed for energy efficiency purposes. This is a proxy indicator, that will be replaced by SCF distribution reporting once available.
The data show an annual increase of 16.1% between 2016 and 2021. This development is classified on track.
This indicator measures what share of energy subsidies is designated for energy efficiency.
It is a proxy indicator and substitutes the future indicator on ‘Social Climate Fund’s targeted support distributed to low-income households’ which will show the total amount of funds distributed to low-income households. The SCF regulation defines ‘vulnerable households’ as households in energy poverty or households, including low income and lower middle-income ones, that are significantly affected by the price impacts of the inclusion of buildings into the scope of Directive 2003/87/EC and lack the means to renovate the building they occupy.
Share of support for households
This indicator shows past development in the share of EU energy subsidies distributed to households. This a proxy indicator, that will be replaced by SCF distribution reporting once available.
The data show an annual increase of 16.1% between 2017 and 2022. Even though the rate of funds distributed to households almost doubled between 2021 and 2022, this was almost entirely due to direct fossil fuel subsidies as a consequence of the Russian invasion of Ukraine. While energy efficiency support also grew in the same period, its share dropped as a result of this overall increase. This indicator is assessed as on track but is anticipated to decrease in pace as the emergency fossil fuel subsidies will be ending in full.
This indicator measures the share of energy subsidies that is distributed directly to households.
It is a proxy indicator and substitutes the future indicator on ‘Social Climate Fund’s targeted support distributed to low-income households’ which will show the total amount of funds distributed to low-income households. The SCF regulation defines ‘vulnerable households’ as households in energy poverty or households, including low income and lower middle-income ones, that are significantly affected by the price impacts of the inclusion of buildings into the scope of Directive 2003/87/EC (EU ETS Directive) and lack the means to renovate the building they occupy.